9:18:07 min, 3000m, 3:06min/km (4:83min/mile).
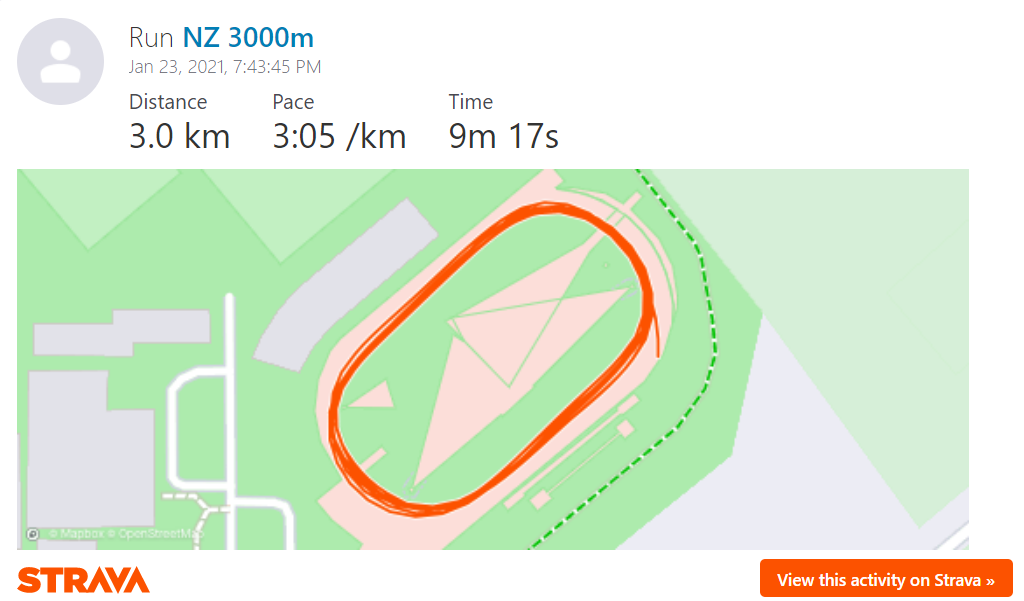
Going into the race, my goal was to run under 9 minutes. It was an ambitious goal, to say the least. Not only was I amidst training for the 2021 Tarawera 102km Ultramarathon, but my previous 3000m performance was 9:45:87 (3:15min/km).
I prepared by polarising (long slow | short fast) my training and doing one specific track session each week for the four weeks leading into the race.
- 3000m time trial (9:47)
- 1000m + 10x 200m | 1:30min rest
- 3000m race (9:45)
- 1600m + 5x 300m | 1:30min rest
- 2000m + 3x 400m | 1:30min rest
- Race – 9:18
(Buy this training plan for $19 for Pace or Power)
My plan was to target my biggest weakness; my ability to tolerate high lactic acid concentrations. I knew I could run fast, I knew I was fit, but I found out during my initial TT that my ability to tolerate lactate was not great. I like to differentiate between lactate buffering capacity (tempo/threshold) and lactate tolerance. In metric terms, we can use the critical power model to get more insight.
Your critical power is your theoretical aerobic threshold (red line). It is calculated by plotting your recent best performances against time. The result is a power duration curve (Figure 1 – blue line).
The area under the curve is your anaerobic work capacity or W prime (W’). W’ relates to the amount of energy you have available above your threshold. It explains why can’t sprint forever. Read more here.
I have plotted my 3000m race (purple line) against my previous 90-day PDC to explain why I slowed so drastically during my race.
400m race splits
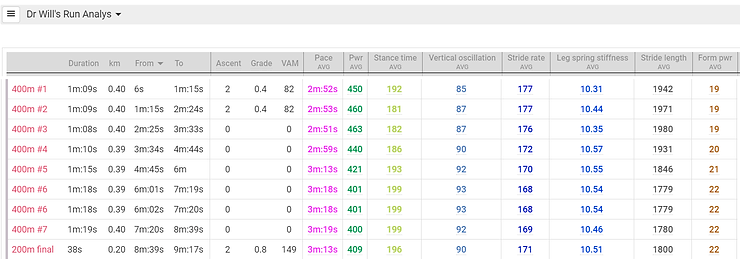
I’ve place a purple arrow where my race power output overtook my 90-day best. It was at 1 minute! Yes, after 1 minute I was running faster than I had in all of my prior training, some of which included 400m efforts. After about 3min I was significantly above my 90-day best, which meant I was quickly using up my anaerobic work capacity (W’).

Once you use up your W’, you will be forced to operate below your critical power (red line). Mainly due to the accumulation of hydrogen ions in the muscle tissue and CO2 in the bloodstream. Looking at my race data fill, you can see I slowed from start – finish (Figure 3, pink & green). That occurred because I went so fast at the start. If I had started slower, say in line with my overall average power (429W), I could have better distributed my anaerobic capacity and allowed for an overall faster race.

To learn more about running power, check out my other blogs and podcasts on the topic.
If you’d like help understanding running power data as a coach or athlete, you can book a time with me via my “coaching” tab.
You can purchase my five-week 3000-5000m PB training plan for power (here) and pace (here) for $19.
Running with a Power Meter Online Masterclass – $129. Three-part online course to get yourself set up and familiar with using a running power meter. Available NOW.
